A proper planning of the number and displacement of the BLE nodes is the key of a successful installation of Bluetooth Beacon Tracker. The number and the displacement depends on what you want to get from the system. You can get either:
- the X-Y locations of the BLE beacons detected by the BLE nodes.
- or the proximity of the BLE beacons from the BLE nodes.
Deployment to retrieve the X-Y locations
In a test area (lab or office)
Number of nodes
Very often we are asked what is the minimum number of nodes for a test installation of Bluetooth Beacon Tracker inside an office/lab. We recommend to carry out a test installation with at least 6 BLE nodes. This is the right number of nodes to get meaningful results and understand how the system behaves with the nodes arranged in different configurations. Keep in mind that 6 nodes can provide meaningful results in an area of about 300 sqm. If you want to test the system in a bigger area then you should refer to the next chapter to understand how to estimate the correct number and placement of nodes in a bigger area.
Displacement of nodes
As explained inside the page related to the accuracy factors, the most accurate results can be obtained when tracking beacons within the virtual perimeter that connects the most outer nodes. This is the reason why the first step during the deployment of the nodes, is to place them along the perimeter of the area that will contain BLE beacons to be tracked. Once a first set of nodes has been placed along the perimeter then you can place the remaining nodes uniformly inside the area that you want to monitor.
In a production environment
Number of nodes
There is no unique and standard equation to compute the number of nodes and there is no limits regarding the maximum number that can be managed by our server (as explained in this page). Increasing the nodes density will always increase the system accuracy. If you want a rough estimate regarding the number of nodes needed to monitor all the beacons within a specific area (with a specific level of accuracy) you can use this formula:
![\[BLE Nodes = (\frac{\sqrt{Area}}{Node Spacing}+1)^{2}\]](https://indoortracking.com/support/wp-content/ql-cache/quicklatex.com-c9a564050ea79c8d56a5e8ada0415485_l3.png "Rendered by QuickLaTeX.com")
Here is a rough estimate of how the level of accuracy varies with the NODES SPACING:
HIGH accuracy (2 meters of avg. radius of accuracy) -> ~10 meters of NODES SPACING
LOW accuracy (4 meters of avg. radius of accuracy) -> ~15 meters of NODES SPACING
You can use this tool to estimate the number of nodes needed to cover a specific area.
Displacement of nodes
The most accurate results can be obtained when tracking beacons inside the perimeter defined by the nodes. This is why the first step during the deployment of the the nodes, is to place them along the perimeter of the area that will contain beacons to be tracked. Once a first set of nodes has been placed along the perimeter then you can place the remaining nodes uniformly inside the area that you want to monitor.
These are examples of where to place the nodes in production environments:
Deployment to retrieve the proximity
Important notes about this type of deployment
- this deployment allows to make assertions regarding the proximity of the BLE beacons detected with respect to the BLE nodes by analyzing the RSS. With this deployment Bluetooth Beacon Tracker will not provide the X-Y locations of the BLE beacons detected. The locations of each one of the BLE beacons detected will be equal to the locations of the BLE node that is detecting the highest signal strength.
- even if it is true that the RSS value decreases as the distance from the node increases, it is also true that the RSS value does not decrease linearly and it is also affected by different materials in the environment. For these reasons we suggest to perform some empirical tests to determine how the RSS varies with the distance from the nodes (the spots) in your specific environment. These kind of empirical tests can be performed following the instructions in this page.
Number of nodes
It is necessary to install one node for each one of the spots that need to be monitored.
Displacement of nodes
We suggest to install each one of the nodes at the center of each specific spot that needs to be monitored.
These are examples of where to place the nodes in production environments:
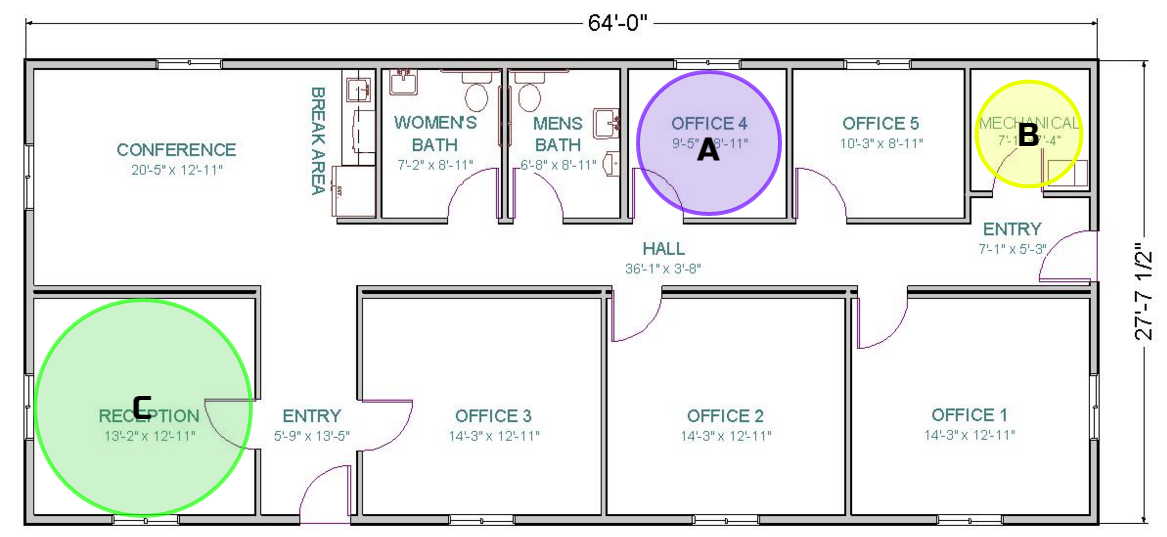
The deployment of the example in the image above allows to monitor 3 spots. All the beacons detected by specific nodes with a RSS value equal or greater to a chosen threshold will be considered as inside a specific area (inside a specific radius).
Example of rules and thresholds:
- If the RSS detected by node A is greater or equal to -50 dBm then the beacon is inside the VIOLET area.
- If the RSS detected by node B is greater or equal to -35 dBm then the beacon is inside the YELLOW area.
- If the RSS detected by node C is greater or equal to -70 dBm then the beacon is inside the GREEN area.
Let us do the estimates
We will be pleased to help you compute the exact number of nodes and the ideal displacement. To do so please provide us:
- a floor plan with a unit of measurement and the highlighted areas that need to be monitored.
- any information regarding constraints related to the placement of the nodes.
- (OPTIONALLY) a floor plan with the locations of the electricity outlets (this is needed in order to minimize the number of extension cords).
- (OPTIONALLY) 5 pictures of the environment.
We will be pleased to provide an estimate regarding the number of nodes needed and the deployment model suggested.